
Crypto chart patterns sheet knowledge turns charts into actionable data. Master these proven formations to stay ahead of the volatile crypto market.
- How to Secure MetaMask Wallet Extensions: 5 Critical Hardware Isolation Workflows
- The Correction Explained: Why Is Crypto Dropping So Fast?
- Best Ethereum Staking Protocols: 14 Elite Services to Maximize Your Monthly Crypto Salaries
- Liquid Staking vs Restaking: Which Yield Engine Dominates 2026?
- Spot vs Futures Crypto Structural Factors: Analyzing Risks and Rewards
Navigating the volatile cryptocurrency market requires reliable indicators and strategic foresight. Traders constantly seek visual maps to decode market trends and anticipate future price actions. A structured Crypto Chart Patterns Sheet serves as an indispensable tool, transforming complex, chaotic price movements into recognizable shapes and actionable insights.
Related: Decoding Market Trends with a Crypto Chart Patterns Sheet: 4 Expert Tips
By analyzing recurring crowd behaviors, these sheets help traders make data-driven decisions rather than relying on pure emotion. To maximize the effectiveness of this technical asset, traders must understand how to read, verify, and implement these formations correctly. Here are four expert tips from CryptoInsight to master market trends using your visual reference guide.
Essential Formations in a Crypto Chart Patterns Sheet
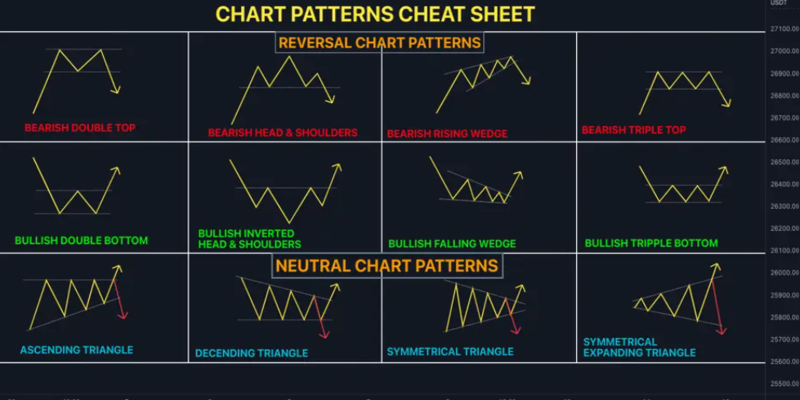
Before executing any trades, you must familiarize yourself with the fundamental structures found on a high-quality reference guide. Cryptocurrencies move fast, making it critical to quickly differentiate between a continuation structure and a potential market reversal. A comprehensive Crypto Chart Patterns Sheet categorizes these shapes to streamline your technical analysis process.
The market generally presents three types of formations: bullish setups that hint at upward momentum, bearish setups that warn of incoming drops, and bilateral structures where price can break out in either direction. Understanding these categories prevents premature market entries.
- Reversal Formations: Shapes like the Double Bottom or Inverse Head and Shoulders indicate that the current downtrend is losing steam. Conversely, a Double Top signals that bulls are exhausted and a downward turn is imminent.
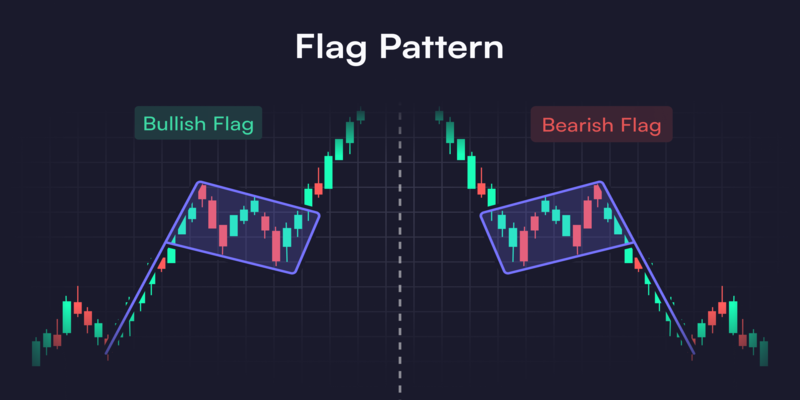
- Continuation Formations: Flags and Pennants show that the asset is taking a temporary breather before continuing its primary trend.
- Bilateral Formations: Symmetrical Triangles represent market indecision where buyers and sellers are tightly matched, preparing for an aggressive breakout.
| Pattern Type | Common Examples | Market Implication | Success Rate Index |
| Bullish Reversal | Inverse Head & Shoulders, Double Bottom | Downward trend flips to upward momentum | High (80% – 84%) |
| Bearish Reversal | Head & Shoulders, Double Top | Upward trend flips to downward momentum | High (80% – 82%) |
| Continuation | Bullish Flag, Bearish Pennant | Price pauses before resuming initial path | Moderate (65% – 70%) |
| Bilateral | Symmetrical Triangle, Rectangle | Price consolidates; potential breakout either side | Variable (55% – 60%) |
Mastering Market Analysis with Four Expert Tips
Read More : Best DePIN Crypto Projects: 11 Infrastructure Cryptos Dominating 2026
Using a Crypto Chart Patterns Sheet requires more than just matching shapes on a live screen. To protect your capital and find high-probability setups, you need an organized approach. Implementing these four professional tips will significantly elevate your chart reading accuracy.
Tip 1: Always Wait for Volume and Candlestick Confirmation
A common mistake among novice traders is entering a position before a shape fully forms. Your Crypto Chart Patterns Sheet might show a perfect Ascending Triangle, but the pattern is completely invalid until price breaks through the resistance line. Always verify breakouts with a sharp increase in trading volume. High volume indicates that institutional money is backing the move, reducing the likelihood of a devastating fakeout.
Tip 2: Align Patterns Across Multiple Timeframes
A bullish pattern on a 15-minute chart can easily fail if the daily chart is in a massive downtrend. Experts use their Crypto Chart Patterns Sheet to find structural alignment across various timeframes. If you spot a bullish flag on the 4-hour chart while the daily chart shows a strong support bounce, the probability of a successful trade increases dramatically. Always trade in the direction of the macro trend.
Tip 3: Establish Concrete Risk Management Parameters
No technical formation boasts a 100% win rate in the highly volatile crypto space. When identifying a setup using a Crypto Chart Patterns Sheet, immediately calculate your invalidation point. For instance, if you trade a Double Bottom breakout, place your stop-loss order slightly below the breakout neckline or the recent swing low. Never risk more capital than your trading plan allows, regardless of how perfect the visual setup appears.
Tip 4: Combine Geometry with Momentum Indicators
Do not trade chart formations in complete isolation. Use your Crypto Chart Patterns Sheet alongside technical indicators like the Relative Strength Index (RSI) or the Moving Average Convergence Divergence (MACD). If a crypto asset forms a bearish Double Top while the RSI shows a clear bearish divergence, you have multiple layers of confluence confirming an optimal short entry.
Avoiding Common Pitfalls in Pattern Recognition
Read More : Recover Lost Private Key Failures Safely with Cryptographic Methods
Even with a detailed guide handy, traders often fall victim to psychological traps and analytical errors. The crypto market is highly susceptible to sudden liquidity sweeps and whale manipulation, which can distort classic technical shapes. Recognizing these structural anomalies is just as important as identifying the standard formations.
Many market participants suffer from confirmation bias, searching for specific shapes that validate their pre-existing bullish or bearish biases. To maintain objectivity, look at the charts with a neutral mindset and let the data guide your bias.
- Chasing Failed Breakouts: Price often spikes above resistance momentarily to trap aggressive buyers before reversing aggressively.
- Ignoring Market Context: A textbook bullish continuation setup can completely disintegrate if Bitcoin undergoes a sudden liquidity flush.
- Overcomplicating the Charts: Trying to map out dozens of micro-patterns simultaneously leads to analysis paralysis. Focus on the cleanest, most obvious formations.
Enhancing Trade Precision Through Structured Checklists
To build consistency, integrate your Crypto Chart Patterns Sheet into a strict pre-trade checklist. This disciplined approach ensures you only risk capital when all technical conditions are perfectly met. Over time, this routine filters out impulsive, emotion-driven trades.
Before opening any position, verify the validity of the asset’s structural structure. For comprehensive platform tutorials and institutional-grade trading tools, checking out educational resources on analytical sites like Bloomberg or BitKeep can greatly refine your technical accuracy.
- Checklist Item 1: Is the pattern fully formed with at least two or three touches on the trendlines?
- Checklist Item 2: Does the breakout candle close outside the pattern boundary on a significant timeframe?
- Checklist Item 3: Is the trading volume expanding during the breakout move?
- Checklist Item 4: Is the risk-to-reward ratio for this specific trade at least 1:2 or higher?
By combining a physical or digital Crypto Chart Patterns Sheet with rigid risk protocols and volume confirmation, you transform subjective chart reading into an objective, repeatable trading strategy. Stay patient, wait for the market to validate your setup, and let the historical probabilities work in your favor.
Source: https://cryptoinsight.news
Category: News