
Bitcoin liquidation heat map tracking protects your margin from sudden squeezes. Master the art of spotting hidden leverage traps on live crypto charts.
- Decoding Market Trends with a Crypto Chart Patterns Sheet: 4 Expert Tips
- Analyzing the Top Utility Tokens: Which Projects Offer Genuine Value?
- Is DeFi Dead? Deep-Dive Review of Institutional Decentralized Finance Platforms
- Read Crypto Candlestick Charts: A Comprehensive Guide for Beginners
- 5 Strategic Steps on How to Trade Crypto Options with Lower Risk
A Bitcoin liquidation heat map is one of the most powerful data tools available to modern crypto traders. In highly leveraged crypto markets, whale entities and market makers regularly seek out heavy clusters of retail stop-losses and liquidation prices to fuel their own large orders. By visualizing exactly where these forced liquidation orders sit on a price chart, you can avoid common trading traps and protect your capital.
Related: 4 Trading Mistakes a Bitcoin Liquidation Heat Map Helps You Avoid
Let us dive deep into the specific mechanics of forced order execution and explore how reading leverage data transforms your market perspective.
Understanding the data structure behind a Bitcoin liquidation heat map
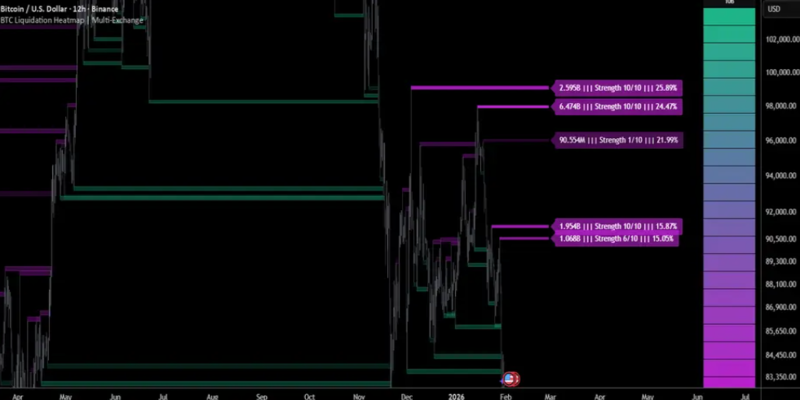
A Bitcoin liquidation heat map operates by aggregating real-time data from major futures exchanges to calculate where forced liquidations will occur based on leverage distributions. When a retail participant opens a high-leverage position, their liquidation price becomes a fixed mathematical point on the exchange ledger. The map visualizes these data points using bright color gradients, with intense colors highlighting areas where billions of dollars in liquidations are heavily concentrated.
For technical analysts, these high-density zones act like massive financial magnets for price action. Crypto markets are inherently driven by a constant search for liquidity, meaning the price will frequently sweep through these clusters before making a true reversal. By observing a Bitcoin liquidation heat map, you gain the ability to look directly behind the standard candlestick chart to see the actual financial risk of current market participants.
- Bright color clusters: Represent massive pools of pending forced orders that market makers look to target.
- Dark or dull areas: Indicate low-leverage zones where price is unlikely to face sudden, violent cascading liquidations.
- Timeframe scalability: Allows traders to monitor liquidity distributions on daily, weekly, or macro monthly outlook charts.
Eliminating the 4 trading mistakes with a Bitcoin liquidation heat map
Read More : Are Fed Interest Rate Crypto Policies Stalling the Next Bull Run?
Using this visualization tool is the most efficient way to systematically eliminate the 4 trading mistakes that consistently wipe out retail trading accounts. Many traders treat the market as a purely psychological game, completely ignoring the mechanical realities of automated liquidation engines. When you understand how exchanges manage distressed positions, you stop falling into repetitive traps designed to harvest liquidity.
The table below serves as a direct operational reference guide, mapping out exactly how a Bitcoin liquidation heat map exposes these retail blind spots during critical market phases.
| 4 Trading Mistakes | Market Scenario | Core Retail Risk | Optimal Professional Action |
| 1. Chasing Breakouts | Price pumping toward a dense short liquidation wall. | Buying the absolute top of a fake breakout wave. | Sit out or wait to short the subsequent liquidity sweep. |
| 2. Predictable Stop-Losses | Placing stops directly at obvious swing highs or lows. | Getting hunted by market makers during routine stop-runs. | Set invalidation points completely outside high-density color clusters. |
| 3. Misjudging Squeeze Velocity | Trading in a low-liquidity void with no leverage buildup. | Getting stuck in choppy, erratic, and failing momentum. | Only trade breakouts that have a massive stack of leverage fuel. |
| 4. Catching Falling Knives | Buying a heavy dump based only on historical support lines. | Getting crushed by a cascading long liquidation waterfall. | Wait for the heat map to show full liquidation exhaustion first. |
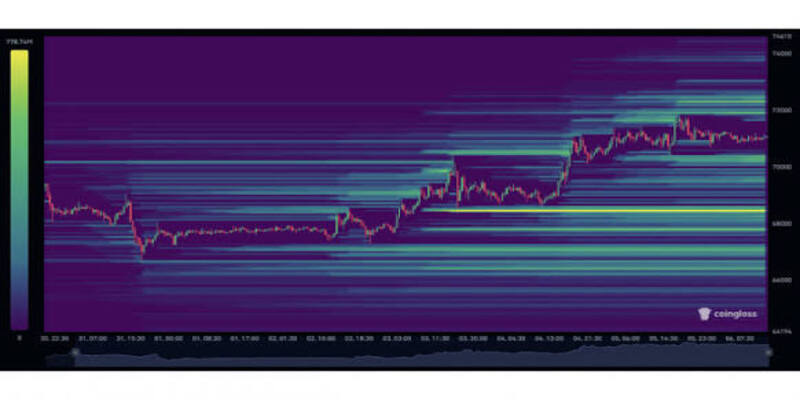
Setting predictable stop-loss orders inside high density liquidation zones
The second fatal blunder that monitoring a Bitcoin liquidation heat map prevents is placing your protective stop-loss orders in highly predictable, exposed technical regions. Most retail participants are taught to place their stops directly below the most recent swing low or right above the recent swing high. Unfortunately, this robotic placement creates dense clusters of visible liquidity that market makers actively target during routine stop-runs.
When your stop-loss sits right inside a bright, high-density zone on a Bitcoin liquidation heat map, you are virtually guaranteeing that your position will be cleared out before the real move occurs. Smart traders use this valuable data to place their invalidation points safely outside of the primary leverage clusters. This adjustment ensures that your trade is only closed if the macro structure truly breaks, rather than during a minor liquidity wick.
Misjudging short squeeze velocity without a Bitcoin liquidation heat map
The third common error is misjudging the potential speed and magnitude of a short or long squeeze due to a lack of order flow visibility. Without a Bitcoin liquidation heat map, you cannot accurately calculate how much fuel a trend actually has to sustain its current momentum. When a market is starved of liquidity clusters, breakouts will often quickly stall out and fail due to a simple lack of active market participants.
Read More : 5 Quantitative Rules for Crypto Leverage Risk Management in Volatile Markets
Conversely, when a Bitcoin liquidation heat map reveals a massive, multi-tiered stack of leveraged short positions, any small upward move can trigger a violent domino effect. Each forced liquidation triggers an automatic market buy order, which pushes the price higher into the next liquidation level, causing a massive short squeeze. Recognizing these highly explosive structural setups allows you to position yourself early on the right side of a cascading market expansion event.
Catching falling knives without verification from a Bitcoin liquidation heat map
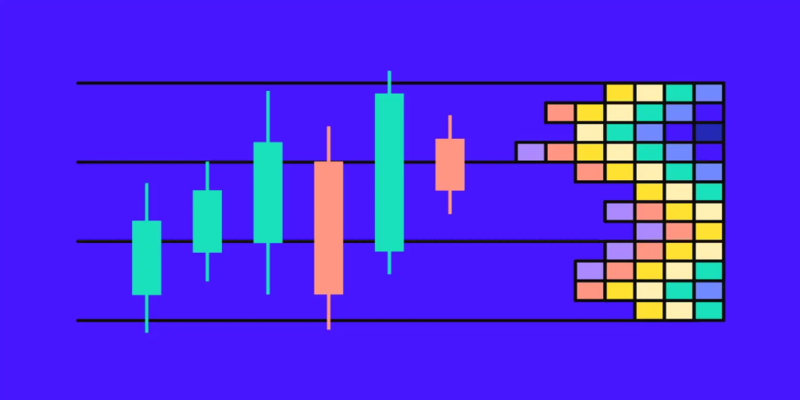
The fourth mistake is attempting to catch a rapidly falling knife during a market panic without verifying where the actual liquidation waterfall will realistically terminate. Many traders try to guess the bottom of a heavy dump by looking at historical support lines that have no real volume backing them up. A severe market flush will easily cut right through traditional support levels if there is an immense chain reaction of long liquidations clearing out.
By checking a Bitcoin liquidation heat map, you can see exactly where the final cluster of distressed long positions is located on the chart. You can then patiently wait for the price to completely clear out that specific high-density liquidity zone before looking for entry signals. This methodical approach ensures you enter the market only after the heavy forced selling pressure has been completely exhausted.
Understanding these advanced liquidity dynamics allows you to transform your charting routine from emotional guesswork into a highly structured, statistical operation. To further elevate your overall market expertise and analyze live data setups, visit the Technical Analysis section of CryptoInsight for daily professional breakdowns. Mastering the specific signals provided by a Bitcoin liquidation heat map will help you protect your capital and navigate volatile crypto trends with elite precision.
Source: https://cryptoinsight.news
Category: News