
Read crypto candlestick charts to decode complex price action. This guide simplifies visual patterns for consistent, data-driven trading decisions.
- 5 Professional Settings for the Best Day Trading Indicators Today
- Crypto Presales High Risk Analysis: 5 Red Flags Compared in Modern Token Launches
- Ledger vs Trezor Review: 4 App Ecosystem Layers for Advanced Staking
- Lend Crypto for Interest: How Beginners Lose Money in Decentralized Money Markets
- Crypto Phishing Scams Guide: Immediate Revocation Tactics for Exploited Wallets
Technical analysis begins with the fundamental ability to interpret raw price data accurately. When you read crypto candlestick charts, you are essentially deciphering the complex battle between buyers and sellers over a specific timeframe. Unlike simple line charts, these visual tools provide immense depth because they capture four distinct data points for every single period: opening, closing, high, and low prices.
Related: Read Crypto Candlestick Charts: A Comprehensive Guide for Beginners
Mastering this skill is vital for any trader operating in the highly volatile digital asset ecosystem. By learning to read crypto candlestick charts, you gain unique insight into market psychology and institutional momentum. This guide will walk you through the essential structural components and the comparative advantages of using these dynamic charts for your daily technical analysis.
Core anatomy when you read crypto candlestick charts
Every individual candle on a screen communicates a specific story about prevailing market sentiment. The “body” of the candle represents the distance between the opening and closing prices, while the “wicks” or “shadows” extend outward to show the extreme price peaks and troughs reached during that specific period.
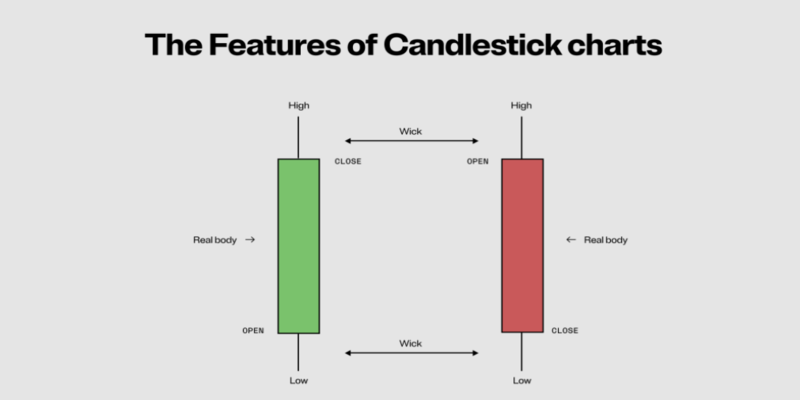
To read crypto candlestick charts effectively, you must understand what color, size, and wick length signify regarding market health:
- Green (Bullish) Body: The asset closed significantly higher than it opened, indicating strong buying pressure.
- Red (Bearish) Body: The asset closed lower than it opened, signaling that selling dominance took over the session.
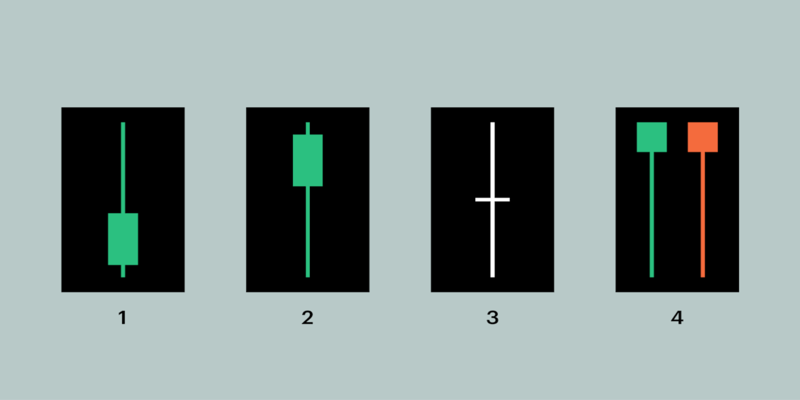
- Long Wicks: These indicate a sharp rejection of a certain price level, suggesting potential trend exhaustion or heavy profit-taking.
- Small Bodies: These represent market indecision, often occurring when volatility is low or the market is consolidating before a breakout.
Comparing visual tools to read crypto candlestick charts vs line charts
Read More : RSI MACD Crypto Trading: How to Validate Breakouts and Avoid Fakeouts
Choosing the right visualization format fundamentally changes how you perceive trend strength and momentum. While many beginners initially prefer line charts for their minimalist simplicity, professional traders almost exclusively read crypto candlestick charts to detect subtle nuances in price action that line charts intentionally ignore. The table below outlines the primary structural differences between these two common analysis methods.
| Feature | Candlestick Charts | Line Charts |
| Data Depth | High (Open, High, Low, Close). | Low (Only closing prices shown). |
| Sentiment | Clearly shows buying/selling pressure. | Only shows general trend direction. |
| Pattern Recognition | Supports complex reversal patterns. | Limited to simple trend lines. |
| Volatility Insight | Visible through wick analysis. | Hidden; volatility is totally smoothed out. |
Line charts are helpful for identifying macro trends over extremely long durations, but they fail to capture the reality of intraday volatility. When you read crypto candlestick charts, you see the hidden liquidity pockets, stop-run zones, and support levels that line charts completely obscure. For active crypto traders, candlesticks are the only reliable way to measure the true intensity of market participants.
Simple steps to read crypto candlestick charts for market entry
Following a systematic approach allows you to filter out chaotic noise when scanning the markets. Use these 4 steps to read crypto candlestick charts and identify high-probability trade setups with significantly greater confidence:
- Analyze the Macro Trend: Start on a higher timeframe, such as the daily or weekly, to understand the primary market direction.
- Locate Key Support and Resistance: Identify areas where price has previously reacted, as these are critical zones for your entry points.
- Spot Reversal Formations: Look for specific patterns like Pin Bars, Doji stars, or Engulfing candles that signal a change in sentiment.
- Confirm with Volume: Always check the volume indicator beneath your chart; a breakout move without high volume is often a deceptive trap.
When you read crypto candlestick charts with this structured approach, you prevent yourself from entering trades based on impulsive emotions. Instead, you wait for the chart to provide objective, mathematical evidence that your hypothesis is valid before committing your capital.
When you read crypto candlestick charts with this structured approach, you prevent yourself from entering trades based on impulsive emotions. Instead, you wait for the chart to provide objective, mathematical evidence that your hypothesis is valid before committing your capital. By focusing on the confluence of multiple technical indicators, you create a defensive moat around your account that guards against premature entries during high-volatility events.
Read More : Crypto Market Crash Today – Is Bitcoin Headed Below the $60,000 Support?
Furthermore, remember to validate these findings with your chosen time horizon. If a reversal signal emerges on a lower timeframe, cross-reference it with the broader daily structure to ensure the trend alignment supports your trade. This disciplined verification process is the hallmark of a professional trader; it ensures that your technical entries are not just based on isolated patterns, but on the cohesive, verified flow of institutional price action across all relevant time intervals.
Interpreting market sentiment
The geometry of the candle tells you exactly who is in control of the market momentum. Long lower wicks often appear at the bottom of a downtrend, signaling that buyers stepped in aggressively to push the price back up. Conversely, long upper wicks in an uptrend indicate that sellers are rejecting higher prices, which could mean a major reversal is imminent.

At CryptoInsight, we emphasize that price action is a language of its own. As you learn to read crypto candlestick charts, you will start noticing repetitive behaviors in how price interacts with moving averages, RSI zones, and horizontal trend lines. Remember that no single indicator is perfect; the context of the overall market structure is always more important than one isolated candle pattern. You must view the candles as a series of events rather than independent units.
Essential precautions when you read crypto candlestick
While candlesticks are incredibly powerful, they are not infallible signals. Always combine your reading with other technical indicators like RSI (Relative Strength Index) or MACD (Moving Average Convergence Divergence) to confirm your entry and exit signals. Relying solely on one candle pattern, such as a “Hammer” or “Shooting Star,” without checking the broader trend can lead to significant, unnecessary losses.
Furthermore, always stay acutely aware of timeframe sensitivity. A reversal pattern that looks bearish on a 15-minute chart might be completely insignificant on a weekly chart. As you continue to read crypto candlestick charts, keep a dedicated trading journal to track which specific patterns work best for your unique style and risk tolerance.
Source: https://cryptoinsight.news
Category: News