
RSI MACD crypto trading setup configurations protect retail capital. Our technical breakdown shows how to cross-verify momentum spikes on live charts.
- Crypto Market Crash Today – Is Bitcoin Headed Below the $60,000 Support?
- Ledger vs Trezor Review: 4 App Ecosystem Layers for Advanced Staking
- Analyzing the Top Utility Tokens: Which Projects Offer Genuine Value?
- Read Crypto Candlestick Charts: A Comprehensive Guide for Beginners
- Ultimate Guide to Building a Crypto Airdrop Farming Strategy for Maximum Capital Gains
RSI MACD crypto trading strategies remain the gold standard for identifying genuine structural breakouts while avoiding market fakeouts. In volatile digital asset environments, single indicators often generate false signals due to sudden stop-runs. By combining a momentum oscillator with a trend-following metric, traders establish a robust system to verify market velocity.
Related: RSI MACD Crypto Trading: How to Validate Breakouts and Avoid Fakeouts
This breakdown explains how these tools operate independently and how they interlock to protect your capital. Understanding the unique architecture of each tool helps you isolate high-probability zones across different timeframes. By tracking both relative asset strength and structural moving average crossovers, you eliminate retail guesswork from your analysis.
The goal is to wait for clear indicator confluence before committing capital to any breakout setup. Let us dive into the specific mechanics that make this dual-indicator approach effective.
Explaining the mechanics of RSI MACD crypto trading indicators
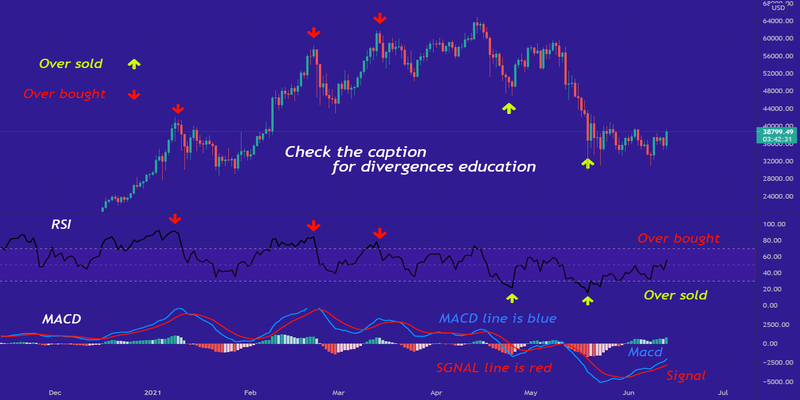
To master RSI MACD crypto trading, you must first understand what each metric measures on a price chart. The Relative Strength Index (RSI) is an oscillator that tracks the velocity of price changes over a fourteen-period window. It moves between zero and one hundred, indicating whether buyers or sellers are overextending.
The Moving Average Convergence Divergence (MACD) functions as a lagging trend-following indicator. It tracks the relationship between two exponential moving averages, typically the twelve-period and twenty-six-period lines. The variance between these lines creates a dynamic signal, while a histogram shows the accelerating strength of the dominant trend.
- Relative Strength Index (RSI): Tracks internal price velocity and immediate overextended market conditions.
- Moving Average Convergence Divergence (MACD): Measures broader exponential trend changes and structural momentum.
- Zero-Line Histogram: Reflects the distance between the primary MACD line and its trigger signal line.
Read More : 5 Professional Settings for the Best Day Trading Indicators Today
Understanding these independent layers prevents you from reacting emotionally to sudden price spikes during your RSI MACD crypto trading sessions. Many traders mistake a quick pump for a major breakout when it is actually just low-volume noise. By filtering price movements through these specific mathematical baselines, you can safely separate true market intent from temporary manipulation.
Metrics for configuring an RSI MACD crypto trading strategy
Developing a blueprint requires mapping how these data points interact during key market phases. The table below serves as a guide for interpreting signals during structural chart breakouts.
| Indicator Component | Bullish Breakout | Bearish Breakdown | Fakeout Risk |
| RSI Value | Holding above 50 | Holding below 50 | Extreme levels |
| MACD Line | Crossover tracking up | Crossover tracking down | Flat/sideways drift |
| Histogram | Expanding green bars | Expanding red bars | Shrinking bars |
Analyzing these parameters ensures your momentum and trend direction are perfectly aligned before executing an order. Many novice traders buy breakouts when the RSI is already at ninety, ignoring that the asset is overextended. By utilizing a balanced RSI MACD crypto trading framework, you ensure entries occur at the start of a wave rather than at its exhaustion point.
This disciplined verification process helps you avoid the common trap of entering a position at the absolute peak of a market cycle. It forces you to rely on structured mathematical evidence rather than fear of missing out. When both metrics confirm the same direction, your probability of maintaining a winning position increases significantly.
Combining indicators to eliminate false breakout signals
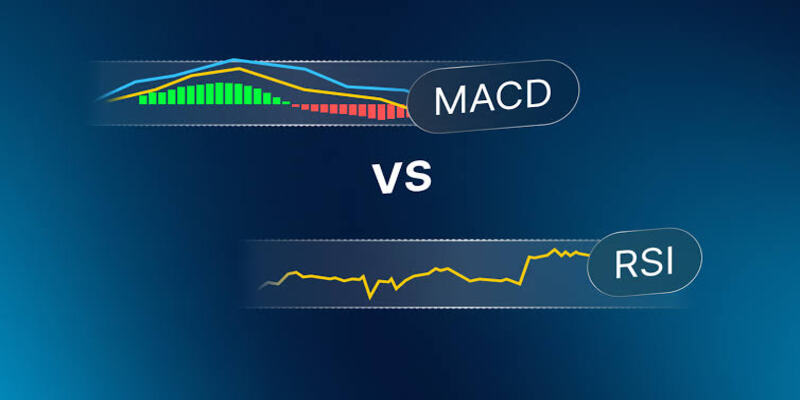
The power of RSI MACD crypto trading emerges when you use the strengths of one tool to neutralize the flaws of the other. Oscillators like the RSI are prone to false signals during runaway parabolic trends. An asset can remain in overbought territory for weeks while the price climbs higher. Layering the MACD over RSI data adds a secondary filter, preventing you from shorting a strong trend.
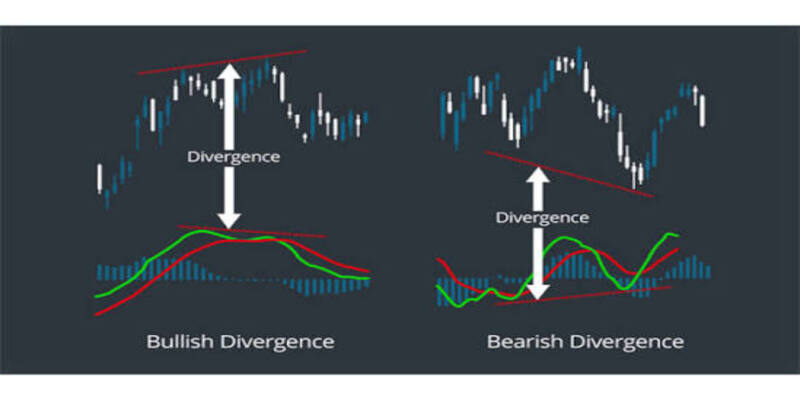
Conversely, the lagging nature of the MACD means it can enter a crossover after a volatile move has already occurred. Incorporating the responsive RSI allows you to spot hidden divergences where the price makes a new high but buying velocity is dropping. When the RSI displays a bearish divergence while the MACD histogram contracts, a fakeout is likely occurring.
Read More : Crypto Technical Analysis Beginners: Mastering Market Trends and Structure
Recognizing this signature protects your capital from buying into institutional liquidity traps designed to harvest retail stop-losses. It allows you to sit patiently on the sidelines while other market participants get caught on the wrong side of the trend. This advanced synthesis of data is what separates professional technical analysis from speculative guesswork.
Validation checklist for executing rules-based trades
Navigating leveraged markets demands an unemotional, checklist-driven RSI MACD crypto trading approach that removes human bias from the process. Before clicking buy or sell, you must verify that multiple layers of indicator confluence are present on your chosen timeframe. This protocol reduces trade frequency while increasing your average profit per trade.
- Confirm structural break: Ensure the candle closes outside of a defined resistance or support zone.
- Audit RSI trajectory: Verify the oscillator value is expanding in the direction of the breakout.
- Check MACD cross: Ensure the faster MACD line has executed a clean crossover matching your bias.
Systematically checking these boxes prevents you from overtrading during periods of low market liquidity. It keeps your mind focused on high-quality setups that offer a clear risk-to-reward ratio. Over time, this mechanical habit builds the emotional resilience needed to survive long-term in the trading industry.
Managing risk and optimizing timeframe settings for active trading
Successful execution of an RSI MACD crypto trading methodology requires selecting the correct timeframes to match your overall trading style. Scalpers might focus on the fifteen-minute chart, while swing traders utilize the four-hour and daily candles to filter out daily noise. Higher timeframes always provide more reliable signals because they aggregate larger volumes of market data and institutional orders.
- High timeframe analysis: Use the daily chart to establish the dominant macro trend and identify primary support zones.
- Lower timeframe entries: Monitor the one-hour chart to pinpoint precise entry triggers based on indicator crossovers.
- Trailing stop execution: Protect your profits by adjusting your stop-loss orders behind key structural moving averages as the trade progresses.
Adhering to these strict rules keeps you on the right side of the market during complex cycles. The Technical Analysis department at CryptoInsight emphasizes that capital preservation is far more valuable than catching every minor market move. By mastering RSI MACD crypto trading setups, you transform your charting approach into a statistical operation. Maintain discipline, monitor performance, and let indicators confirm the trend before risking your assets.
Source: https://cryptoinsight.news
Category: Technical Analysis