
Crypto technical analysis beginners can quickly identify market structural shifts. This guide explains support, resistance, and moving average cross strategies.
- RSI MACD Crypto Trading: How to Validate Breakouts and Avoid Fakeouts
- 5 Professional Settings for the Best Day Trading Indicators Today
- 5 Strategic Steps on How to Trade Crypto Options with Lower Risk
- Liquid Staking vs Restaking: Which Yield Engine Dominates 2026?
- 4 Trading Mistakes a Bitcoin Liquidation Heat Map Helps You Avoid
Crypto technical analysis beginners must learn to read market sentiment directly from price charts rather than relying on gut feelings or social media hype. In the fast-moving cryptocurrency market, chasing rapid price swings without a plan often leads to significant financial losses. By analyzing historical price data and trading volume, crypto technical analysis beginners can identify high-probability setups rather than guessing where an asset will move next. This comprehensive guide serves as your ultimate starting point for mastering market trends and structure.
Related: Crypto Technical Analysis Beginners: Mastering Market Trends and Structure
Developing a rule-based approach protects your trading capital from emotional decision-making during high market volatility. Professional market participants use chart patterns to identify where large institutions are accumulation or distribution assets. As you build your chart-reading skills, crypto technical analysis beginners should focus on developing consistency rather than looking for a single perfect indicator.
Deciphering market structure with help for crypto technical analysis beginners

Market structure is the foundational framework of technical analysis, reflecting the collective psychology of buyers and sellers. For crypto technical analysis beginners, learning to read this structure on a clean price chart is the first major milestone. Prices do not move in straight lines; they move in waves that create distinct structural points.
An uptrend is characterized by a series of higher highs and higher lows, showing that buyers are consistently pushing the floor higher. Conversely, a downtrend consists of lower highs and lower lows, indicating that sellers are firmly in control of the asset. When the price fails to make a new high or breaks a previous low, crypto technical analysis beginners can spot a potential shift in market structure.
- Bullish Structure: Price continuously breaks above previous resistance points while maintaining higher floors.
- Bearish Structure: Price drops below previous support levels while forming lower ceilings.
- Sideways Structure: Price consolidates within a horizontal range, showing an equilibrium between supply and demand.
Read More : 5 Strategic Steps on How to Trade Crypto Options with Lower Risk
Mastering this concept allows you to align your trades with the dominant market momentum rather than fighting against it. Many crypto technical analysis beginners lose money because they attempt to pick market bottoms during a heavy structural markdown phase. By waiting for a clear structural shift, you drastically increase your probability of entering a profitable trade.
Identifying key support and resistance liquidity zones for crypto technical analysis beginners
Support and resistance lines function as the floors and ceilings of the cryptocurrency market. For crypto technical analysis beginners, it is crucial to understand that these are not exact price numbers but rather liquidity zones where buy or sell orders cluster.

When a major resistance zone is broken on high volume, it flips and becomes a new support floor during subsequent market pullbacks. This phenomenon is known as a role reversal and provides reliable entry points for disciplined traders. Identifying these zones helps crypto technical analysis beginners map out the chart before executing any market orders.
| Level Type | Market Psychology | Trader Action |
| Support Zone | Buyers see value, demand overcomes supply, price floors form. | Look for long entries or reversal patterns. |
| Resistance Zone | Sellers take profit, supply overcomes demand, price ceilings form. | Look for short entries or take-profit targets. |
Tracking these zones allows you to place logical protective stop-loss orders just outside the high-liquidity regions. If an asset breaks below a strong support zone, it proves your initial trade thesis is no longer valid. This structured approach ensures that crypto technical analysis beginners keep losses small while winning trades have room to expand.
Utilizing trendlines and moving averages
Visualizing the path of least resistance requires drawing trendlines and applying essential indicators to smooth out daily price noise. Dedicated crypto technical analysis beginners use these tools to maintain a clear directional bias and avoid trading against dominant market forces.
A bullish trendline is drawn by connecting at least two major higher lows in an uptrend, creating a diagonal support line. A bearish trendline connects lower highs, creating a diagonal resistance line. Moving averages calculate the average closing price over a specific number of days, helping crypto technical analysis beginners see a smooth trendline directly on the chart.
- Simple Moving Average (SMA): The basic average price over a set period, ideal for long-term trend tracking.
- Exponential Moving Average (EMA): Gives more weight to recent price action, making it highly reactive to short-term market shifts.
- The 200-Day SMA: Widely considered by institutional traders as the ultimate line separating a macro bull market from a bear market.
Validating structural chart breakouts for crypto technical analysis beginners
Read More : Liquid Staking vs Restaking: Which Yield Engine Dominates 2026?
Many crypto technical analysis beginners fall victim to “fakeouts,” which occur when the price briefly breaks a key level but immediately reverses. To protect capital, smart traders always validate breakouts using trading volume and momentum oscillators like the Relative Strength Index (RSI).
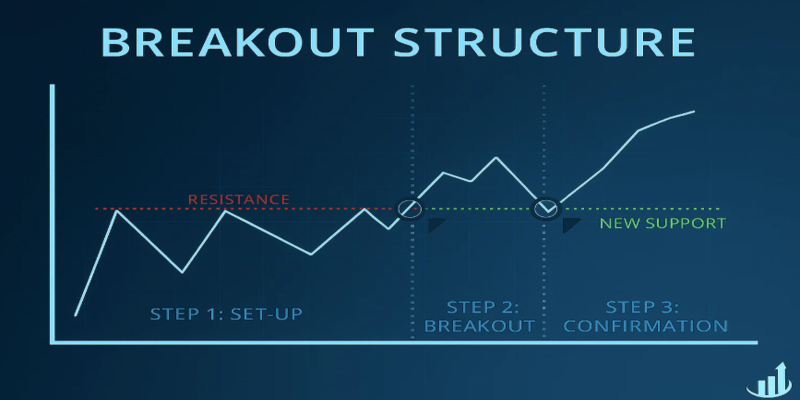
Volume represents the amount of a cryptocurrency traded within a specific timeframe, acting as the fuel behind any price movement. A true structural breakout must be accompanied by a significant spike in trading volume, proving that institutional buyers or sellers are backing the move. If a breakout occurs on low volume, crypto technical analysis beginners know the move lacks real conviction and is highly likely to fail.
The RSI oscillates on a scale from 0 to 100, measuring the speed and size of recent price changes. An RSI reading above 70 indicates that an asset may be overbought and due for a cooling-off period. An RSI reading below 30 suggests the asset is oversold, meaning the selling pressure might be exhausted and a bounce could be near.
Using multiple verification signals prevents you from entering positions prematurely based on emotional impulses. When volume expansion matches an RSI recovery from oversold territory, it provides a strong confluence for crypto technical analysis beginners to spot a trend reversal. Successful traders always wait for the daily chart candle to close before confirming a valid breakout event.
Understanding these core technical principles allows disciplined market participants to cut through the daily noise of volatile digital assets. To further elevate your market expertise and explore live chart updates, visit the Technical Analysis section of CryptoInsight for daily professional breakdowns. Mastering these foundational rules will help crypto technical analysis beginners build a consistent, unemotional, and highly profitable trading routine over time.
Source: https://cryptoinsight.news
Category: Technical Analysis